
|
    Professional Email Marketing Solutions |
Industry benchmark conversion rates for 25 retail categories
Our experts came across these previously published articles we thought you would find useful.
These are re-posts from the original sources. Author: marketingsherpa
In the MarketingSherpa Ecommerce Benchmark Study survey, we asked:
Q. What is your average conversion rate for ecommerce sales (%)?
We also asked:
Q. Which product categories does your organization sell through ecommerce? (Select all that apply)
Below is the chart of responses from 2,885 marketers to these questions. Keep reading for analysis of the data, and feel free to comment with your own analysis as well.
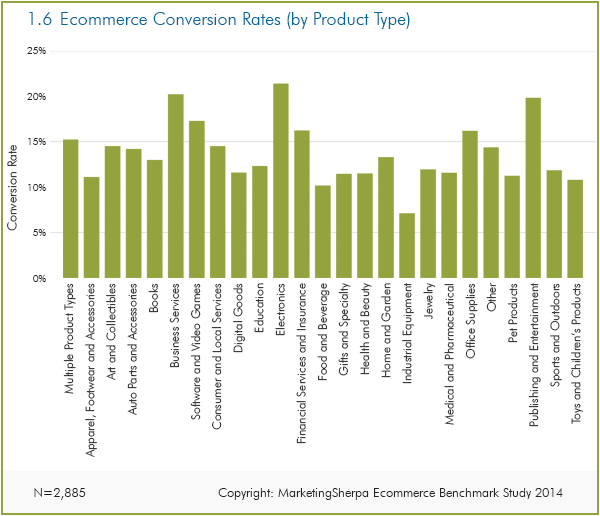
Click here to see a printable version of this chart
Companies selling more products tend to have higher conversion rates …
What is the best way to compete with the mega retailers like Amazon and Walmart?
Some business strategists have suggested to go niche — focus very narrowly on a specific product type and better serve that audience.
While that may work in some instances, the above data suggests there could be flaws in that strategy. We found that the average conversion rate for companies selling only one product was 16.3%, while those selling multiple product categories had a higher conversion rate at 17.2%.
… but not always
This wasn’t the case for all product categories, so there could still be opportunities to have a successful niche-focused value proposition — if you choose the product category wisely.
These six product categories had average conversion rates exceeding the multiple category group:
- Electronics — 24.1%
- Business services — 22.8%
- Publishing, media and entertainment — 22.4%
- Computer software and video games — 19.5%
- Financial services and insurance — 18.3%
- Office supplies or stationery — 18.3%
It should be noted that three product categories had insufficient responses for analysis and were not included in the above chart.
How to interpret this data
You should not view the above conversion rate data in a vacuum. To see the data in context, it helps to download the free MarketingSherpa Ecommerce Benchmark Study, made possible by a research grant from Magento, an eBay company.
You must understand that the above data shows averages, which have been skewed up due to some responses that were much higher than average. You can gain an understanding of the distribution of conversion rate responses by reading previous MarketingSherpa Charts of the Week:
There are many ways to slice and dice conversion rates
The entire point of tracking conversion rates should be to identify opportunities for improvement.
While this Chart of the Week focuses on conversion rates by product type, you will get the most value from your conversion rate data if you segment it in a way that illuminates these opportunities.
This will vary by company, but here are a few examples to get you thinking on which view of conversion rates will help you improve performance.
By channel
Which channels overperform and underperform the investment your company makes in them?
By stage in the funnel
Where in the buyer’s journey are customers dropping off and how can you increase conversion in that stage?
By customer segment
How can you better focus on the needs of specific customer segments to increase conversion? Which customer segments are you currently targeting aren’t really ideal prospects?
Stop investing resources on these areas, and focus on the customers you can best serve.
As one Benchmark Study survey respondent replied:
“We segment our customer base on the basis of end use of the product. We have several product categories, and hence, market products specific to their end-use customers.”
Related Posts:

Leave a Reply

-LK, Magazine and Enewsletter Publisher